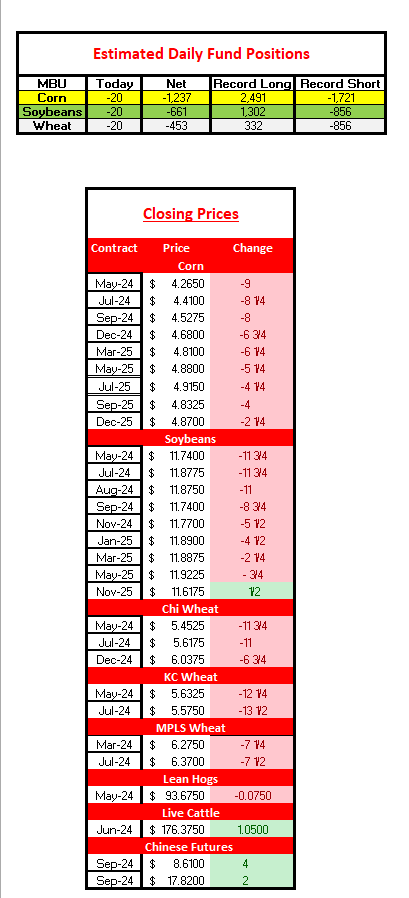
Grains saw another round of selling as the rally from last weeks USDA report has now vanished. For the day, corn closed 8 to 9 cents lower on old crop, and 7 cents lower on new crop. Soybeans dropped 5 cents on new crop, while old crop futures dropped 11 to 12 cents. Wheat also traded in the red, with Chicago wheat down 11 cents, and KC wheat dropped 12 to 13 cents. The outside markets were mixed today, with the Dow Jones index dropping 396 points, and the dollar index down 0.234. Gold rallied $40 an ounce to a new record high of $2,277, and crude oil rallied $1.63. The 10 year treasury yields rallied to 4.36%, the highest levels since last November, and spooked the stocks today.
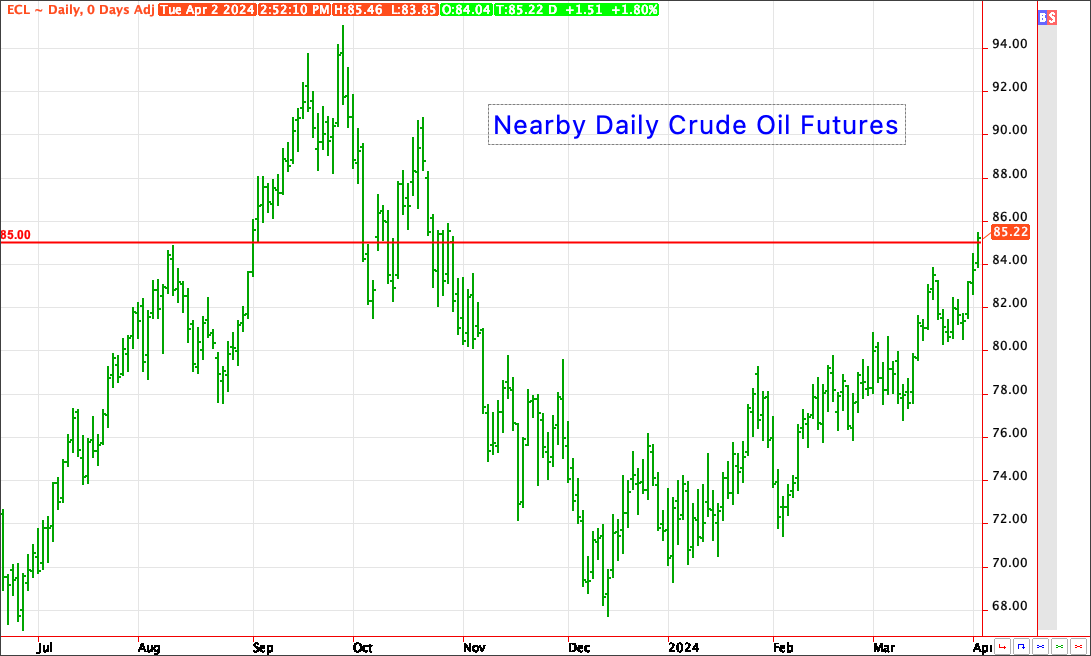
Crude oil futures were helped by reports of Ukraine hitting Russian oil refineries. Drone attacks on the 3rd largest oil refinery in Russia brought new buyers to the energy sector. Reuters reports that 14% of Russian oil refining capacity is offline. There are new concerns of more retaliation from Russia, which could bring new fears in the 2 year + conflict. Below we show the nearby crude oil chart, with crude trading to $85.00 a barrel, the highest levels since last October. The next target could be in the $88 to $90 level.
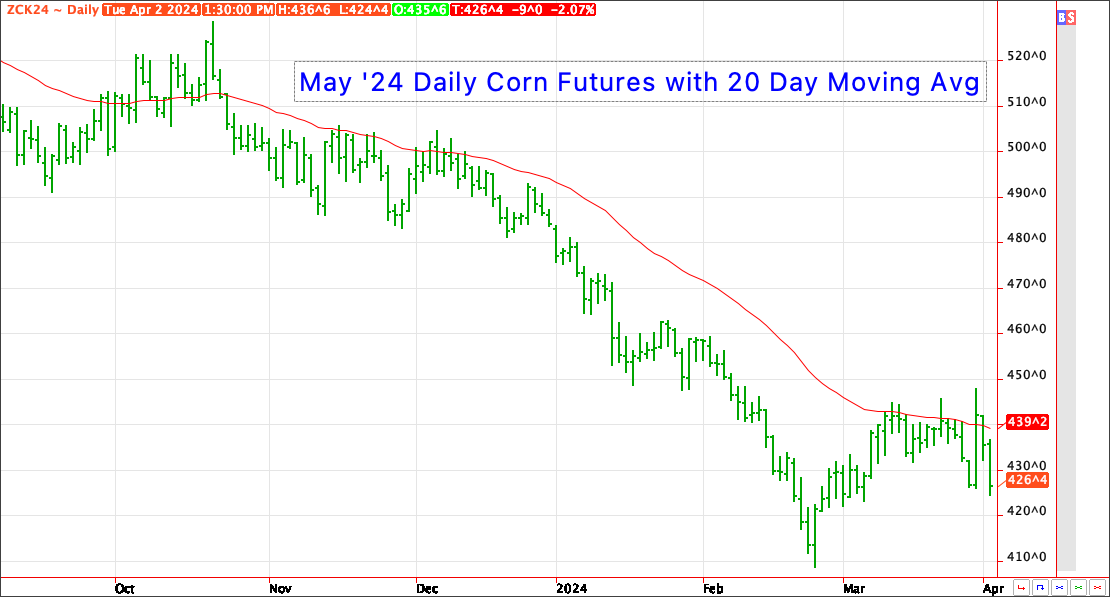
Corn has had two disappointing closes in a row after last week’s bullish crop report. The May ’24 contract traded below levels that were seen on the report day, and now sits about 22 cents off the highs from March 28th. As seen on the chart below, we show the May ’24 daily corn futures contract since last fall. We have had two consecutive closes below the 20 day moving average. To say the price action has been disappointing is an understatement! Farmer selling and hedge pressure has capped the market for the mean time.
The USDA crop report last week came in at 90.036 mln acres of corn. The trade was expecting 91.776 mln acres. Traders have had more time to run their models for yield and production for the 2024/25 crop year, and the odds of a 2 bln + carryout remains high with a yield of 176.5 bpa or higher. Below we show a snapshot of 4 different yield scenarios. A U.S. yield below 174 bpa is needed to get the corn bulls excited for this year. The 5 year simple average U.S. corn yield is at 173.3 bpa, with trend yield closer to 181 bpa.
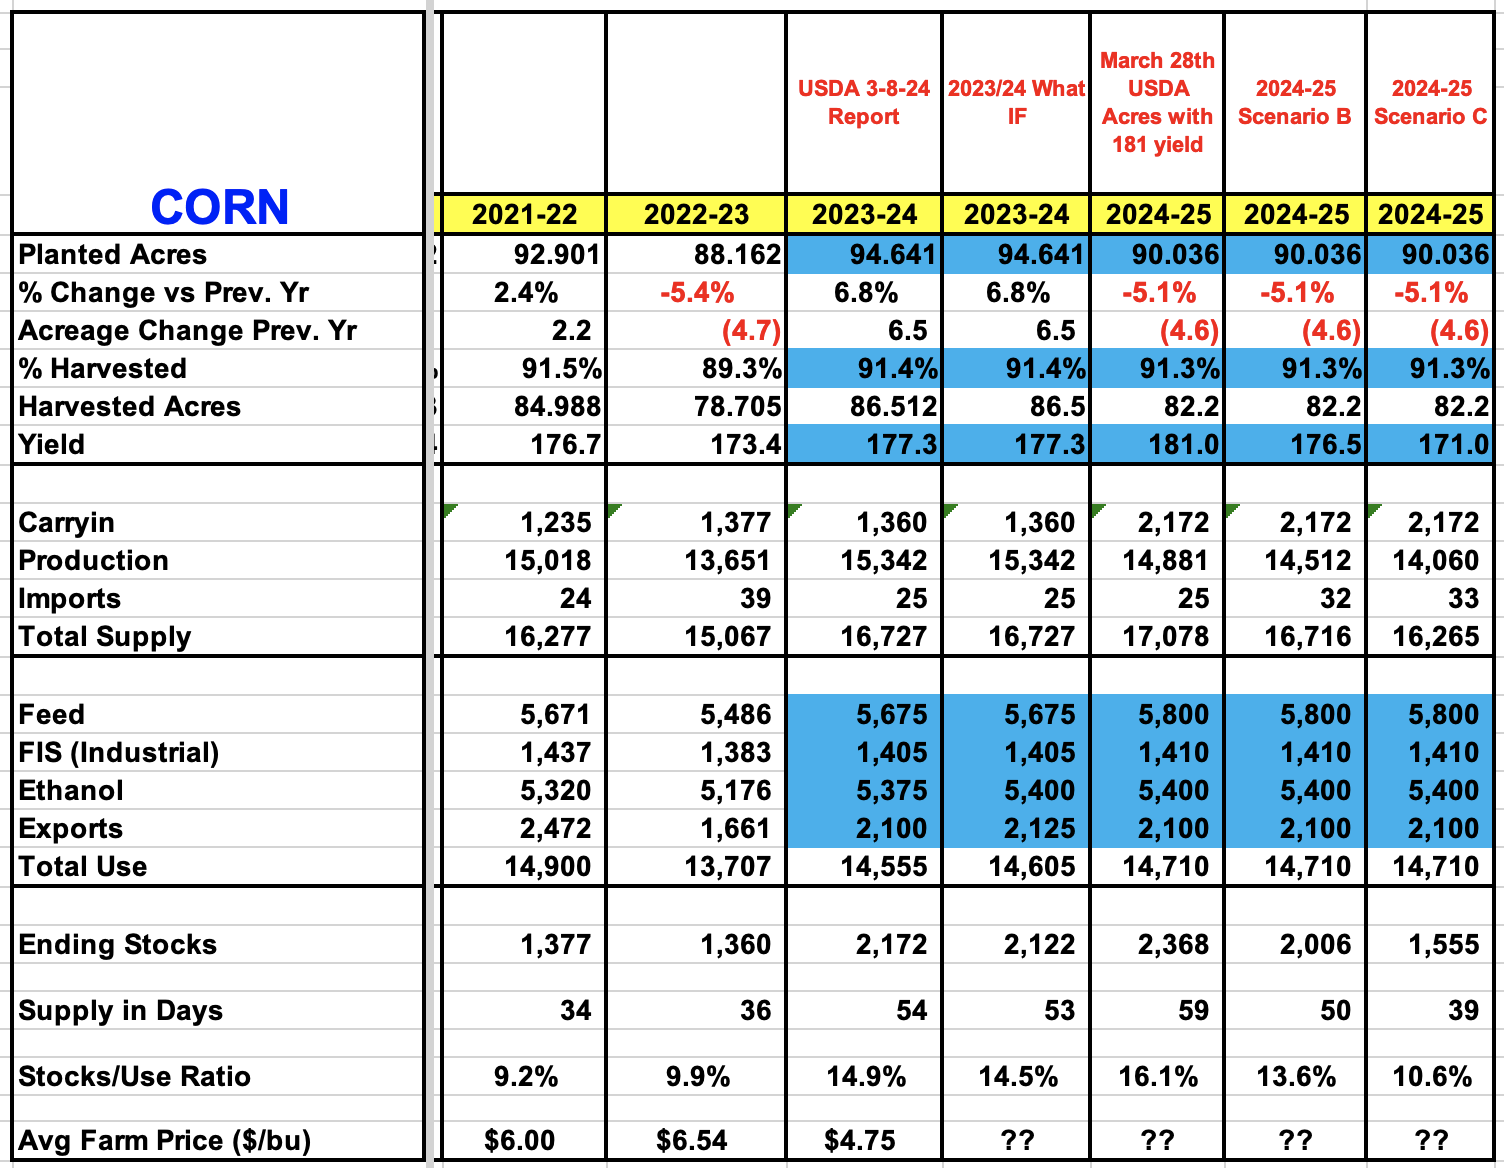
The carryout with 90.036 mln acres planted, 14.710 bln demand, and the yield below is as follows:
181.0 bpa yield = 2.368 bln c/o
176.5 bpa yield = 2.006 bln c/o
174.0 bpa yield = 1.802 bln c/o
171.0 bpa yield = 1.555 bln c/o
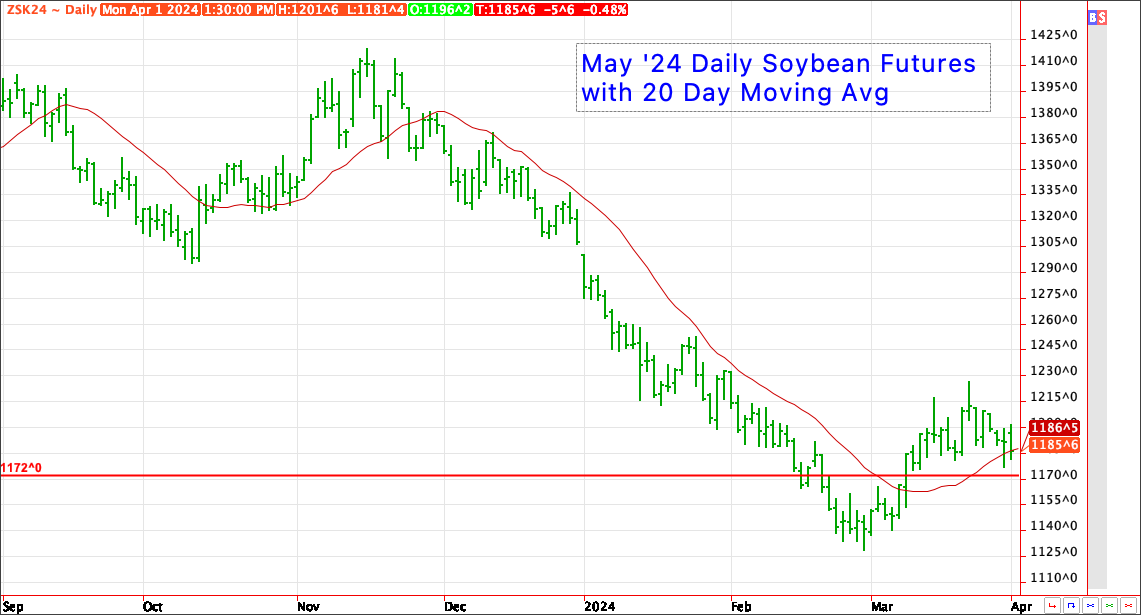
Soybeans have also had a poor start to the week, with selling and hedge pressure seen. The May ’24 contract traded up to $11.9975 today, but closed almost 26 cents off the highs at $11.74. Similar to corn, the price action was disappointing today, but prices are still well off the lows. As the chart below shows, the May ’24 contract closed below the 20 day moving average for the first time since Mid March. We’ll see if the funds will want to add to their short positions after the selloff the last two days.
The USDA crop report last week came in at 86.510 mln acres of soybeans. The trade was expecting 86.530 mln acres. Running our supply and demand numbers with the USDA acres and different yields for the 2024/25 crop year, and it appears a 428 mln bushel carryout could happen with a yield at 52.5 bpa. Below we show a snapshot of 4 different yield scenarios. A U.S. yield below 50 bpa is needed to get the soybean bulls excited for this year. The 5 year simple average U.S. soybean yield is at 50.1 bpa, with the trend yield near 52.0 bpa.
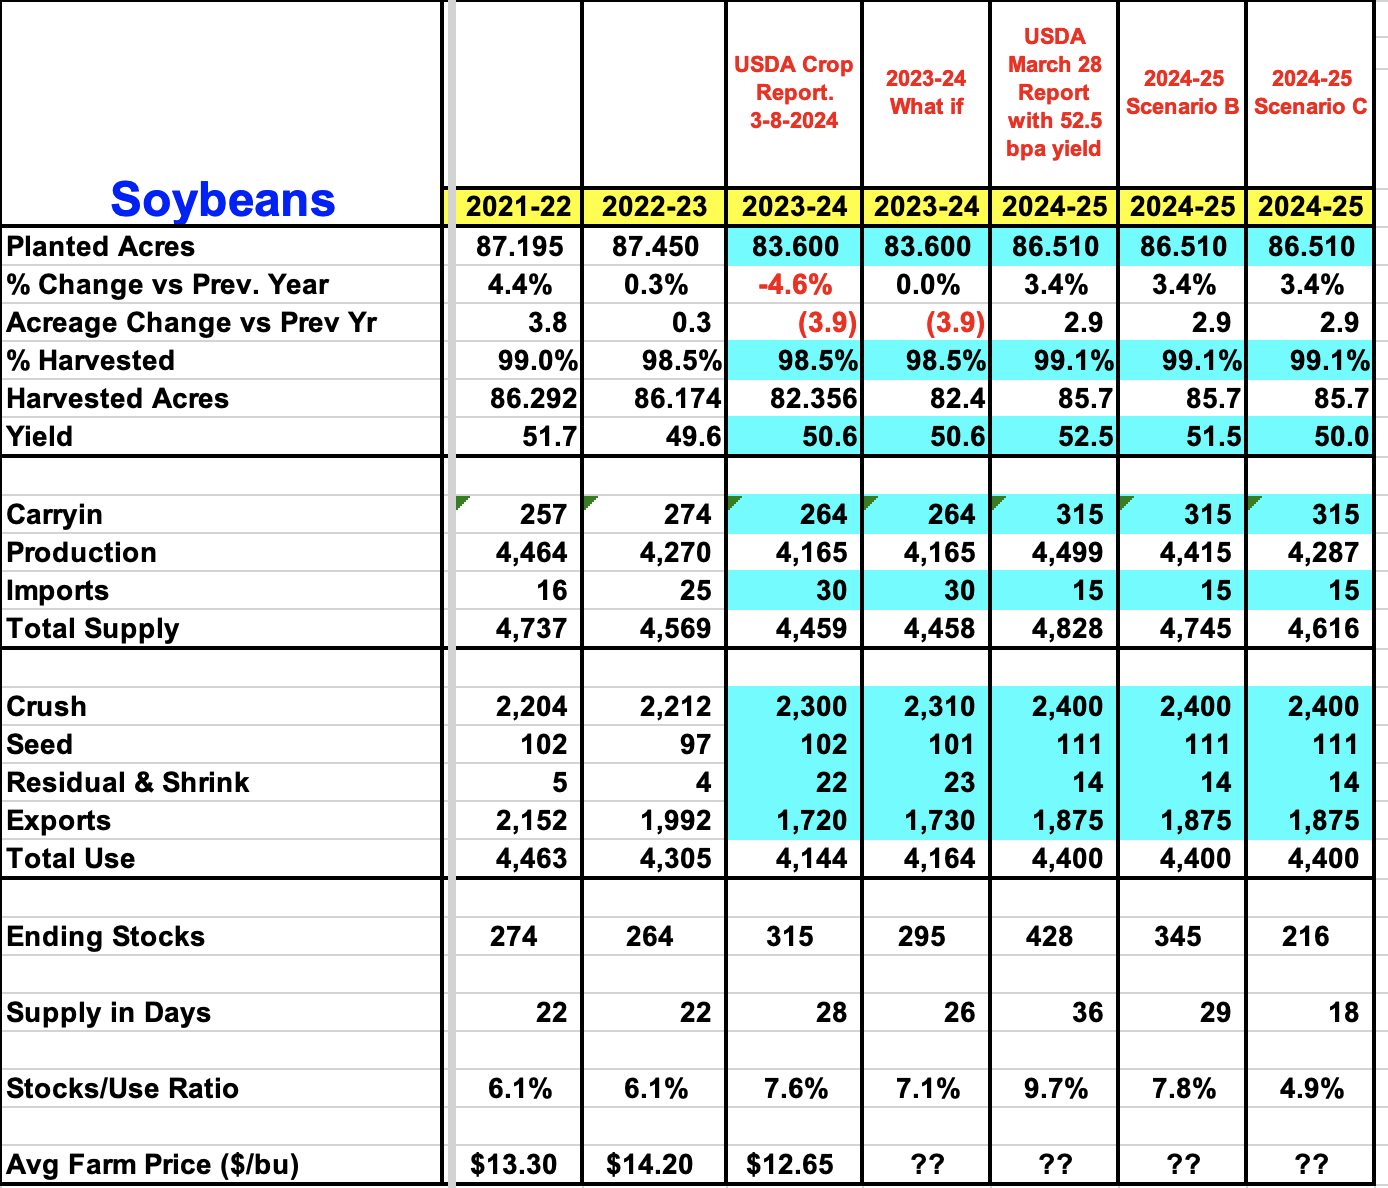
The carryout with 86.510 mln acres planted, 4.400 bln demand, and the yield below is as follows:
52.5 bpa yield = 0.428 bln c/o
51.5 bpa yield = 0.345 bln c/o
50.5 bpa yield = 0.259 bln c/o
50.0 bpa yield = 0.216 bln c/o
Early Planting Dates
The early planting dates for corn in Southern Indiana, Illinois, and Missouri started yesterday on April 1st, and soybeans start April 5th for southern parts of Illinois, Indiana, and Ohio, and April 10th for portions of Iowa, Illinois, and Indiana.
The map below shows the crop insurance corn early planting dates for the 12 main states.
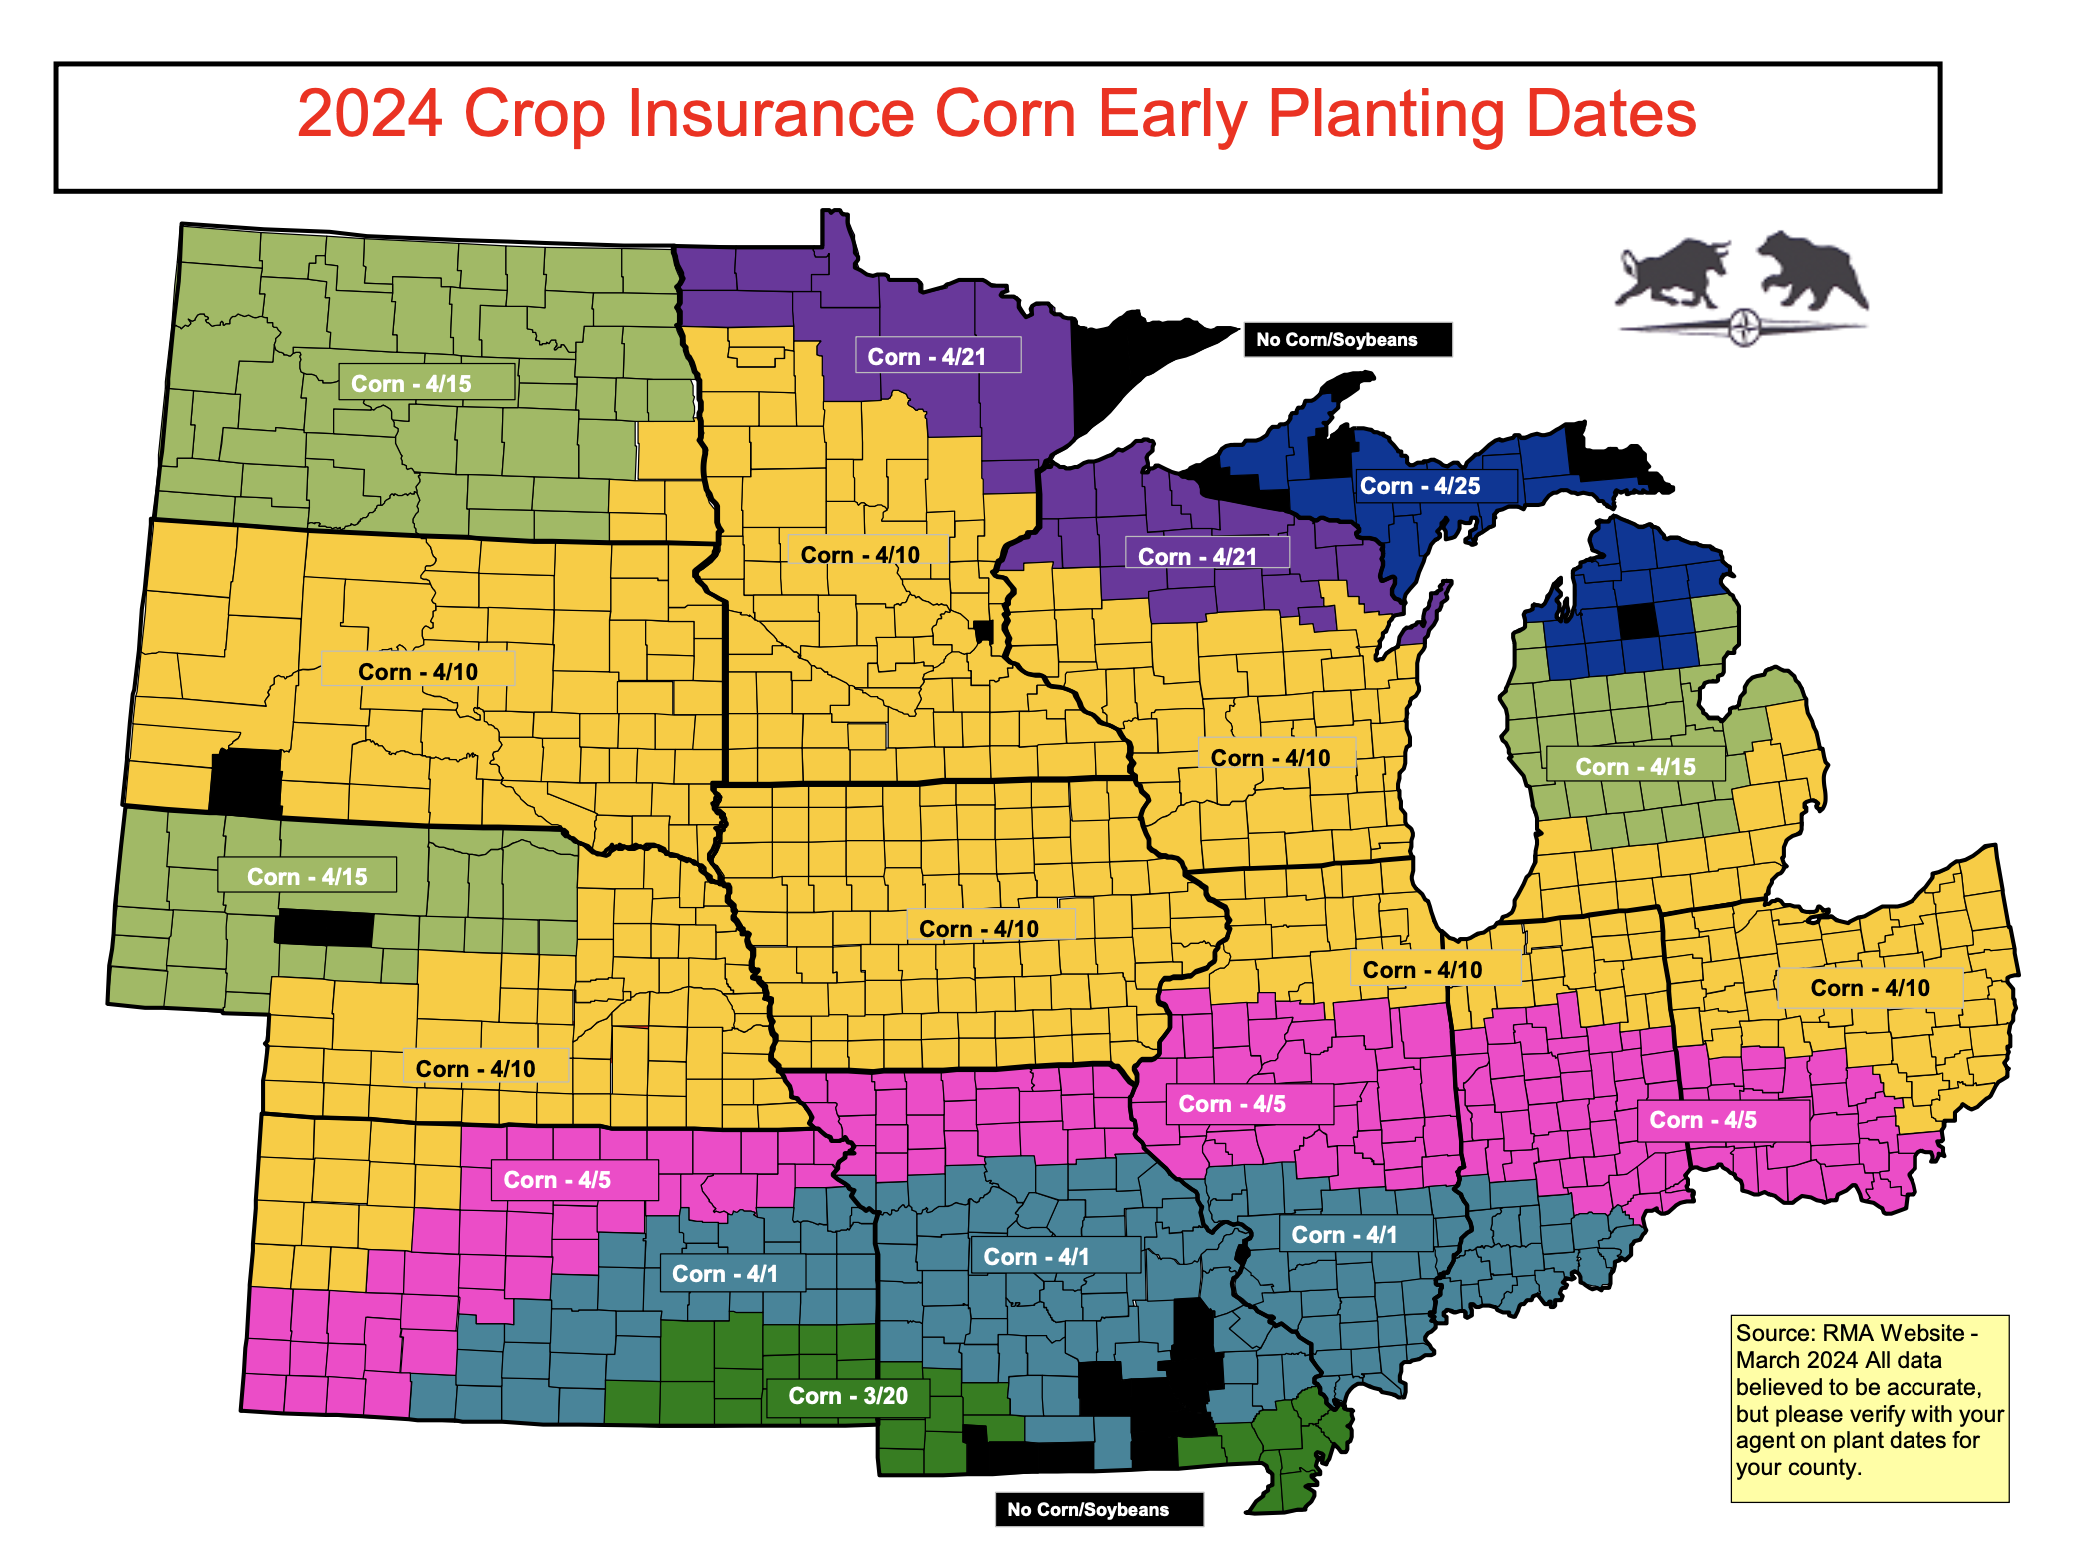
Planting before these early plant dates voids the replant benefits for crop insurance unless producers have a private product replant policy in place. The crop will still have all other insurance coverage. Replant benefits for corn is 8 bu x $4.66 = $37.28 per acre, while soybeans are 3 bu x $11.55 = $34.65 per acre
It’s interesting looking at the dates below to see that North Dakota early plant date on corn is Apr 15th, while producers in Iowa have a start date of Apr 10th. We doubt if much, if any corn gets planted before April 10th anywhere in the I states. The updated 6 to 10 and 8 to 14 day forecast remains warm and wet. Some areas of Iowa, Illinois, and Indiana have seen over 2 inches of rain today, and won’t be in the field anytime soon.
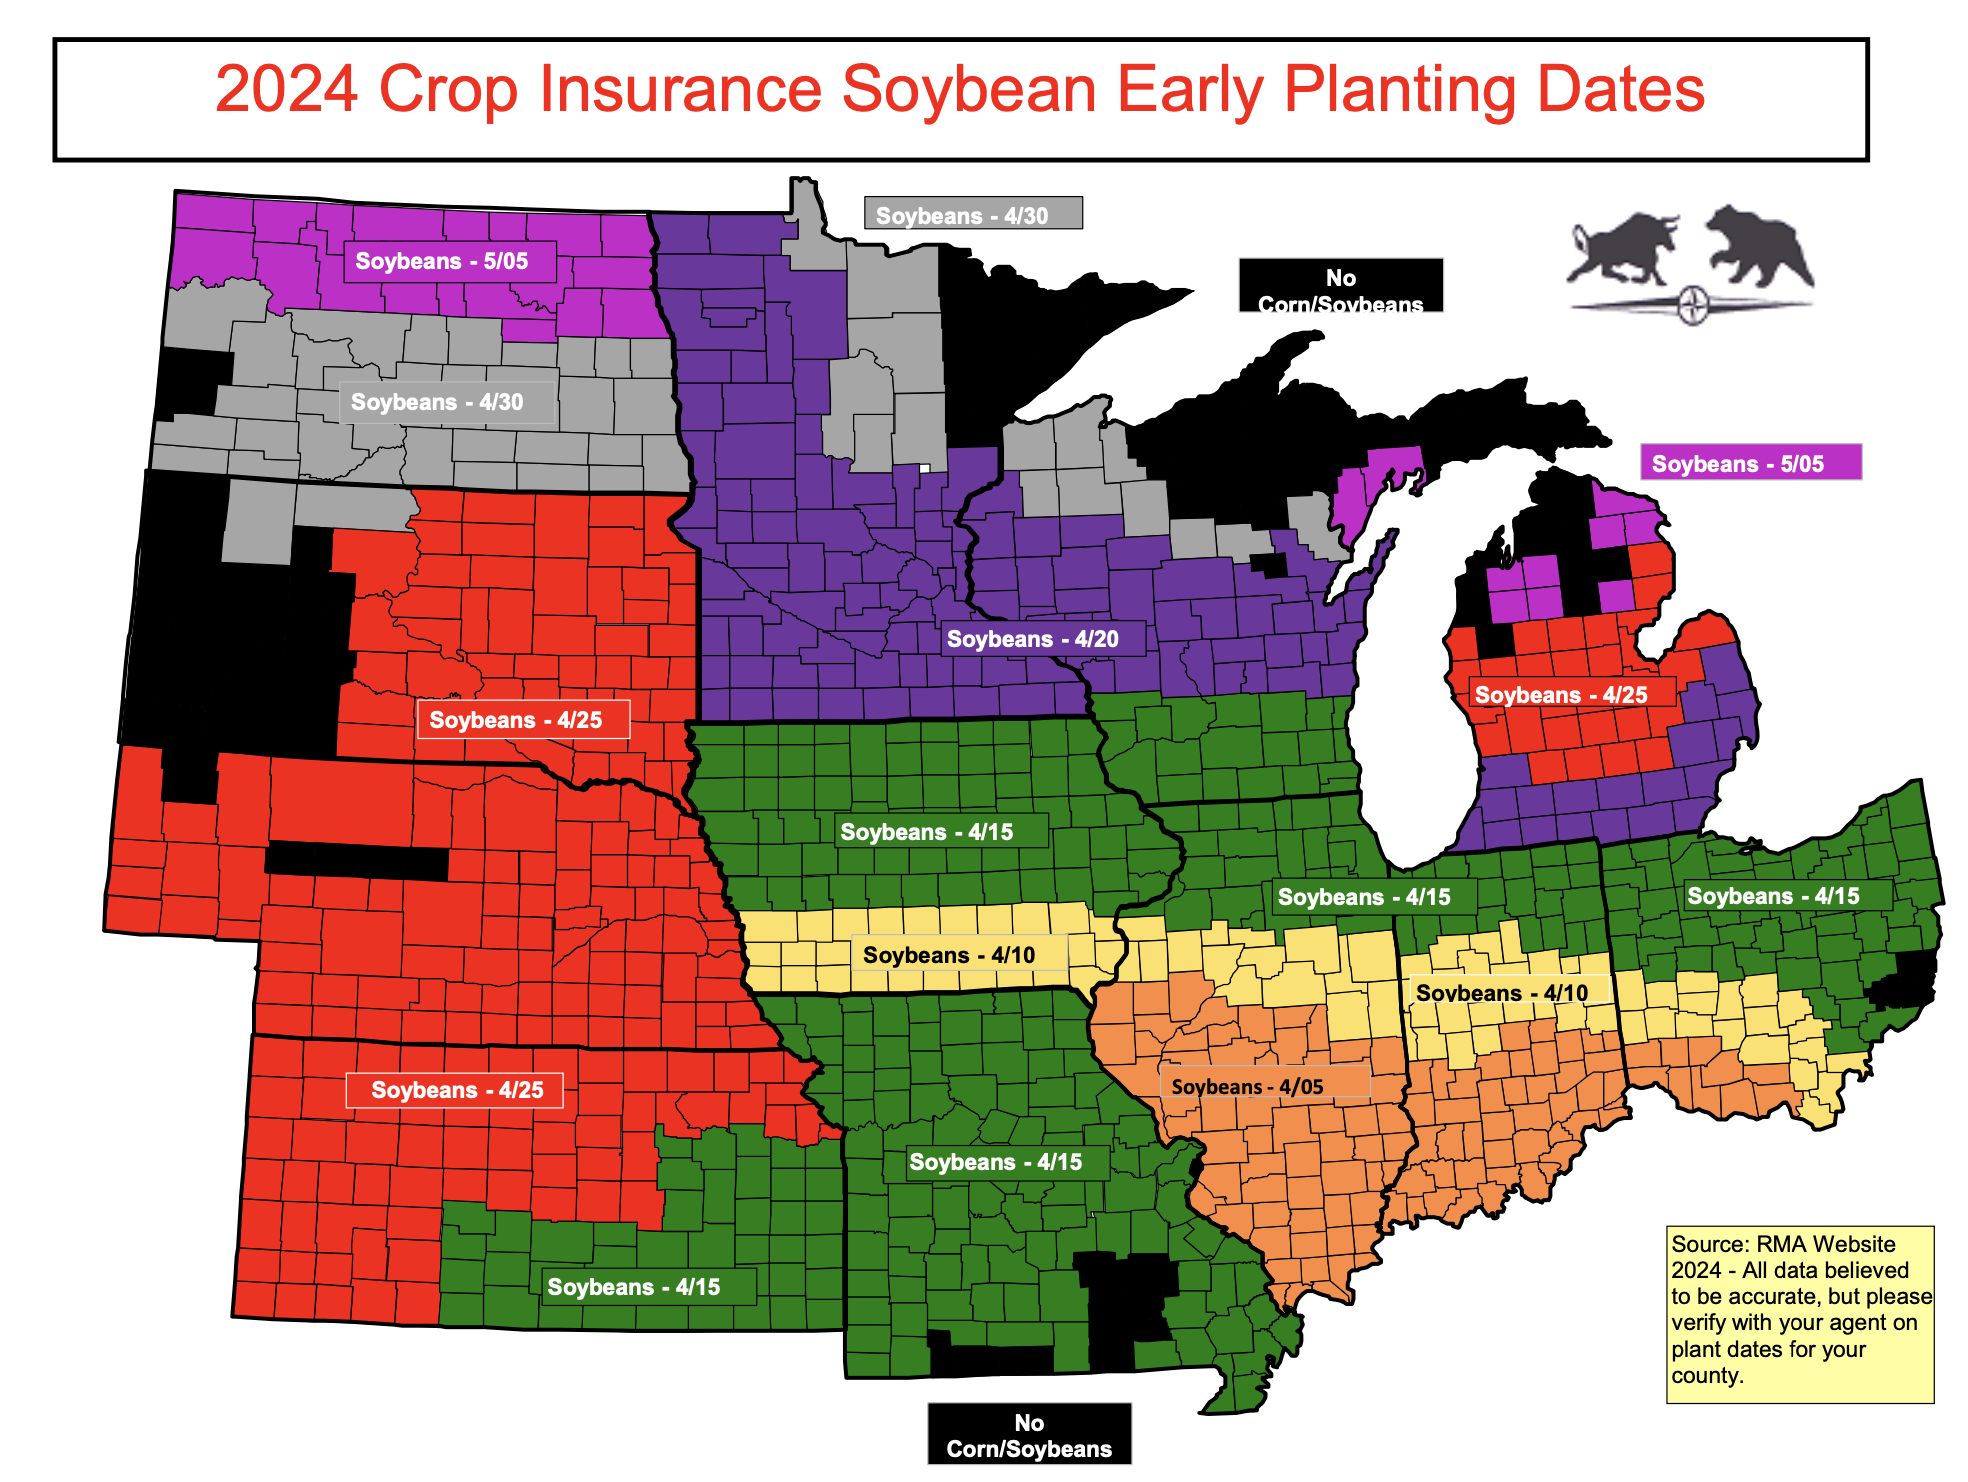
The soybean planting map below shows early planting dates for most Midwestern counties. We had to double check our work, but YES, southern Iowa has earlier planting dates than the whole state of Missouri. There is also a 15 day difference in starting dates in Nebraska (Apr 25) and Southern Iowa (Apr 10). While some of you might not agree with your posted early plant dates, counties just 1 or 2 miles away can have coverage start 10 to 15 days earlier or later than others. We suspect that the RMA will re-visit the start dates on some of these counties to smooth out the start date discrepancies.
That’s all for today. See you here tomorrow!
AgriSource SAF Ethanol comments 3-27-24
Disclaimer: This material should be construed as market commentary, merely observing economic, political and/or market conditions, and not intended to refer to any particular trading strategy, promotional element or quality of service provided by AgriSource Inc. Information contained herein was obtained from sources believed to be reliable, but is not guaranteed as to its accuracy. These materials represent the opinions and viewpoints of the author, and do not necessarily reflect the viewpoints and trading strategies employed by AgriSource, Inc.
AgriSource, Inc. is not responsible for any redistribution of this material by third parties, or any trading decisions taken by persons not intended to view this material. It does not constitute an individualized recommendation, or take into account the particular trading objectives, financial situations, or needs of individual customers. Contact AgriSource, Inc. designated personnel for specific trading advice to meet your trading preferences or goals.