Happy Tax Day! The old saying was you spent the first three and a half months of the year working for the government and now you can finally work for yourself. Depending on where you live you may still have a couple of months to go.
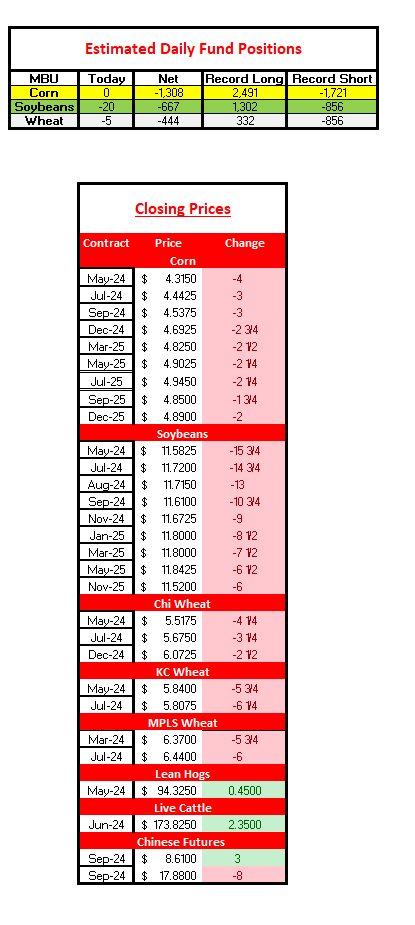
The grain markets greeted Tax Day with lower values across the board with May corn closing 4 cents lower and May soybeans closing down double digits at 15 3/4 cents lower for the day. July CBOT wheat closed 3 1/4 cents lower with KC July wheat closing down 6 1/4 cents. The DJIA closed 248 points lower while May crude oil was down $.05 at $85.61. April gold was up$26.80 at $2393/oz. Gold continued to make historical all time highs with the COMEX May contract up $279/oz IN JUST THE LAST MONTH and up $567/oz. since last October.
The market pretty much erased Friday’s gains as the funds were noted selling 20 mil soybeans and 5 mil. bu. of CBOT wheat. The corn funds reported a net zero number, which is unusual given the front month or May contract was down 4 cents. The corn market shrugged off another solid 50 mil. bu. plus export loadings report and an announced sale by the USDA of 156,000 metric tons to Mexico. The NOPA crush was also solid showing a 10 mln gain vs February and a new one-month record. But soybean exports continue to disappoint as South American beans are about 50 cents a bu. cheaper vs U.S. origins to China.
Corn export inspections came in at a solid 52.4 million bu. vs 56.8 million a week ago. 3.2 mil. went to China while 17 mil. went to Mexico and 11.6 mil. went to Japan. YTD loadings are 1129.29 mil. bu. vs. 844.3 mil. a year ago, or a 33.7% increase from a year ago. Weekly loadings need to average 48.5 mil. to reach USDA projections of 2.100 bil. bu.
Soybean export inspections were 15.9 million bu. vs 18.1 mil. a week ago. 7.3 mil. went to China. YTD loadings are 1.397.7 bil. bu. vs 1.715 bil. bu. a year ago which is a 19% decline from LY. Weekly loadings need to average 15.1 mil. to reach USDA projections of 1.700 bil. bushels. The USDA lowered soybean export projections from 1.720 bil, bu. to 1.700 bil. in last Thursday’s April S&D report.
The March NOPA crush report was released today and came in at 196.4 mil. bu. vs. est. of 197.8. but weas up 10.21 mil. vs February NOPA report. Crush was up 5.7% higher vs LY and a record. Monthly needed drops to 170.8 mil. per month to hit the USDA’s target.
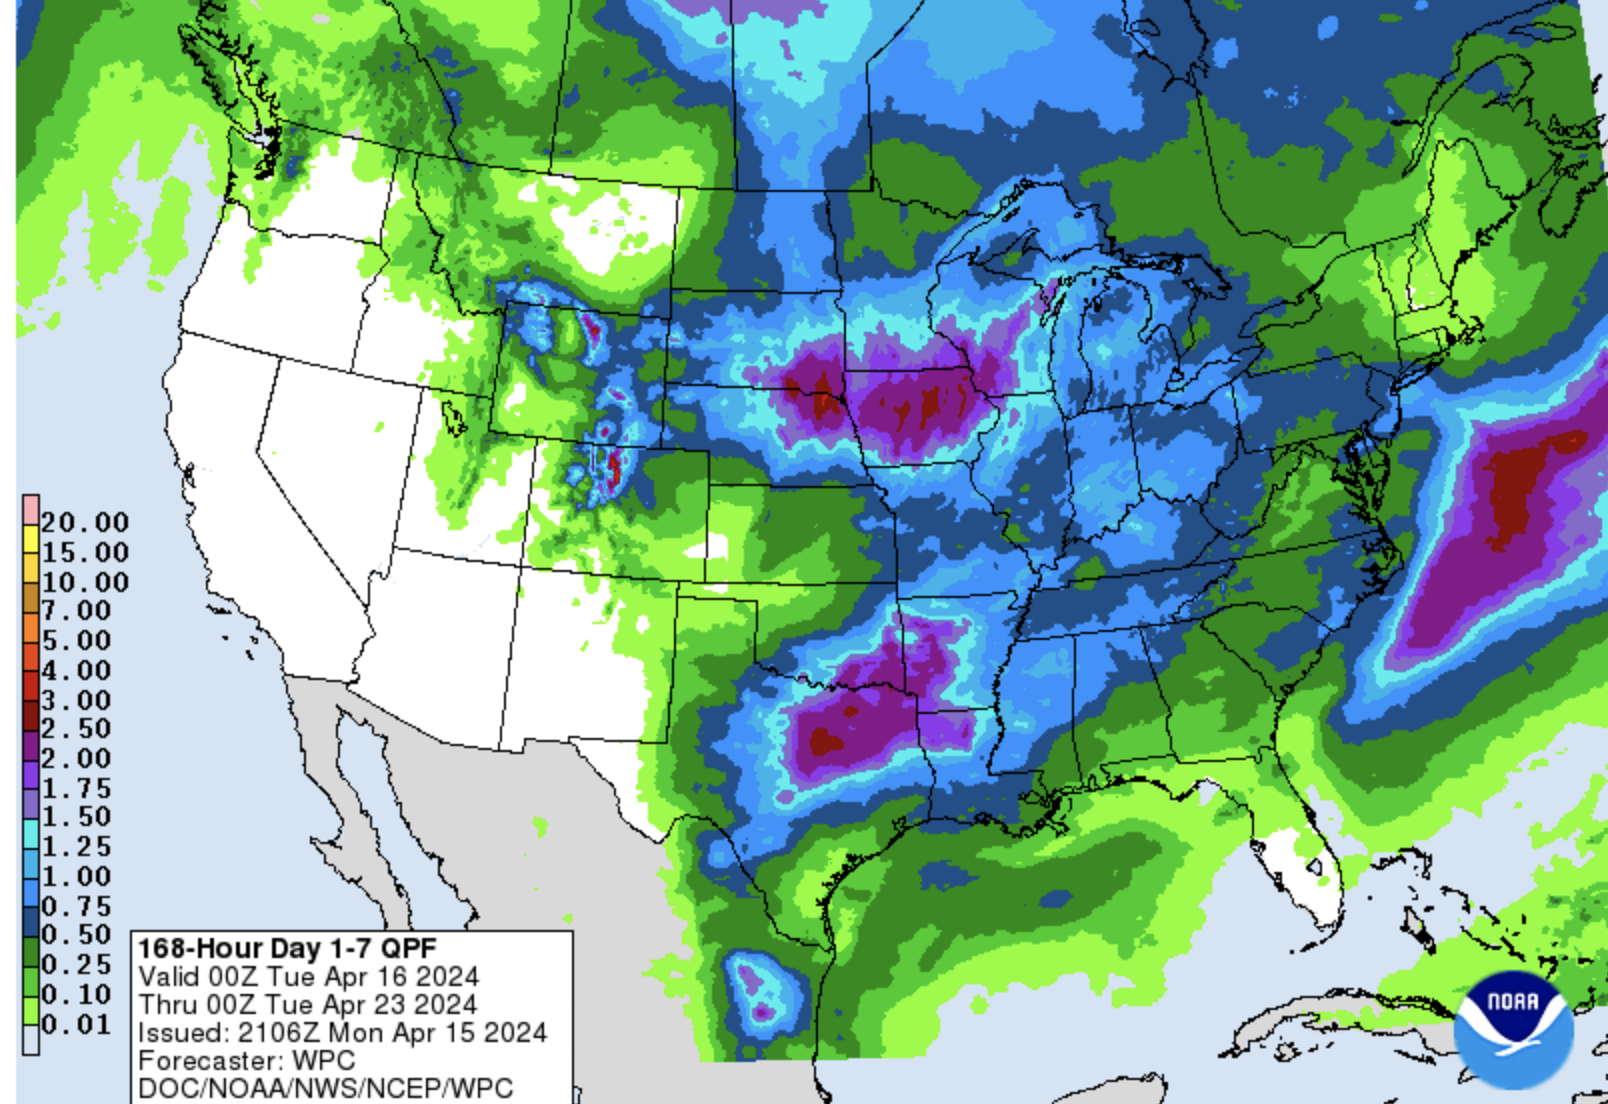
The latest NWS 6-10 forecast calls for cooler and drier than normal conditions in the Midwest but the 8-14 day forecast reverts back to a warmer and wetter pattern with above normal temps and above normal precip expected in the central U.S. Here is the next 7 day expected rainfall map which shows good rains coming for some of the dry areas of Iowa, Minnesota, Nebraska, and South Dakota.
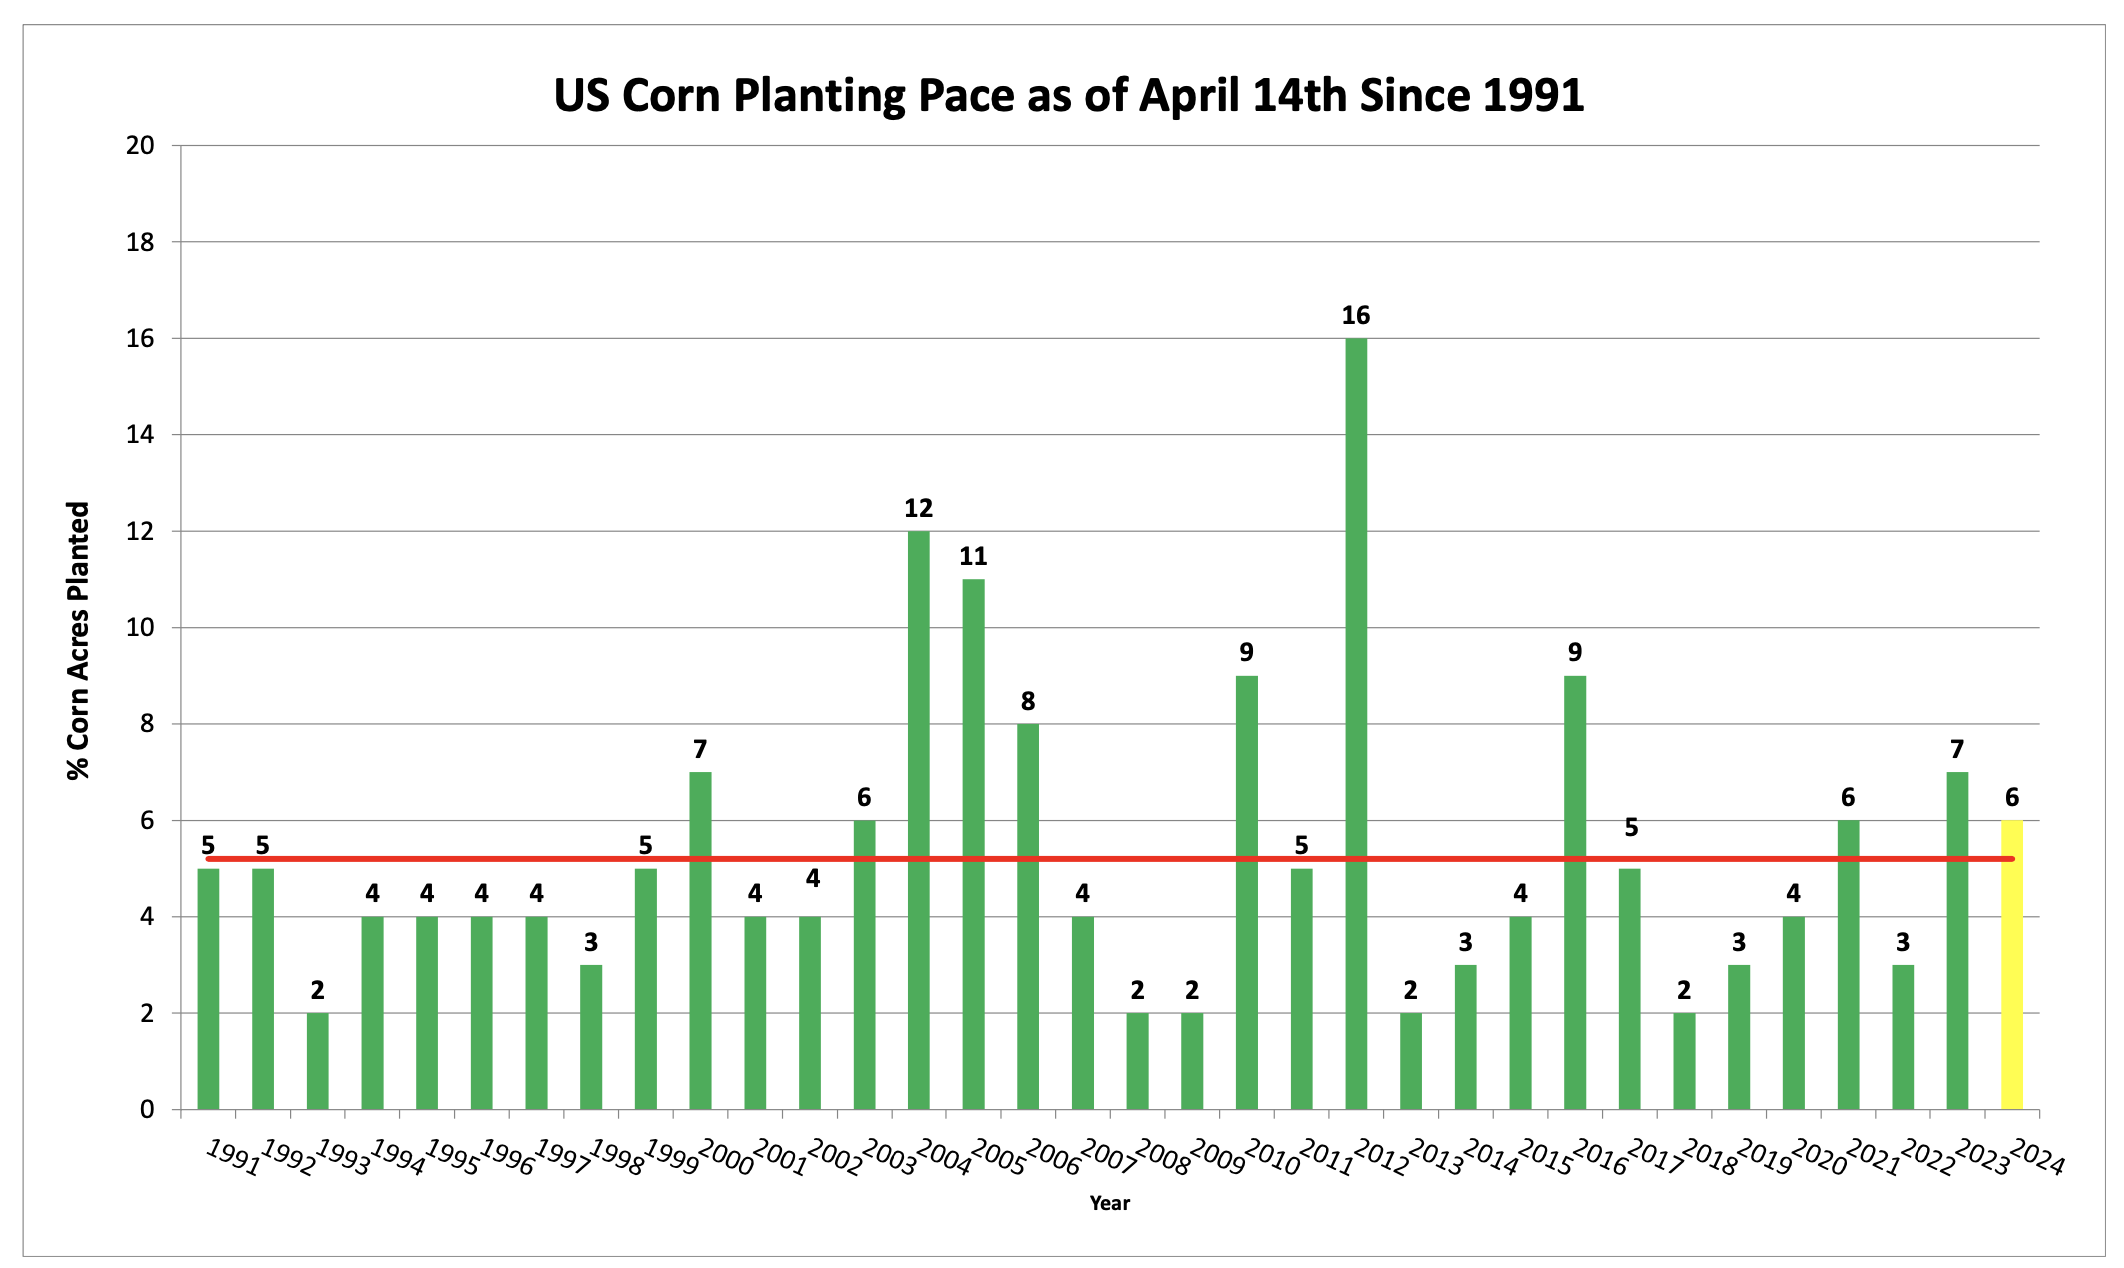
Corn planting progress report was today showed U.S. corn progress at 6% which compares to 3% LW, 7% LY and 5% on average for this date. Illinois showed progress at 3%, IA 4%, IN 1%, MN 3%, MO 26%, NE 2%, SD 1%, KS 13%, KY 91% with TX at 64%. The trade was expecting 7% planted in corn. Here is a look at historical planting progress for April 14th.
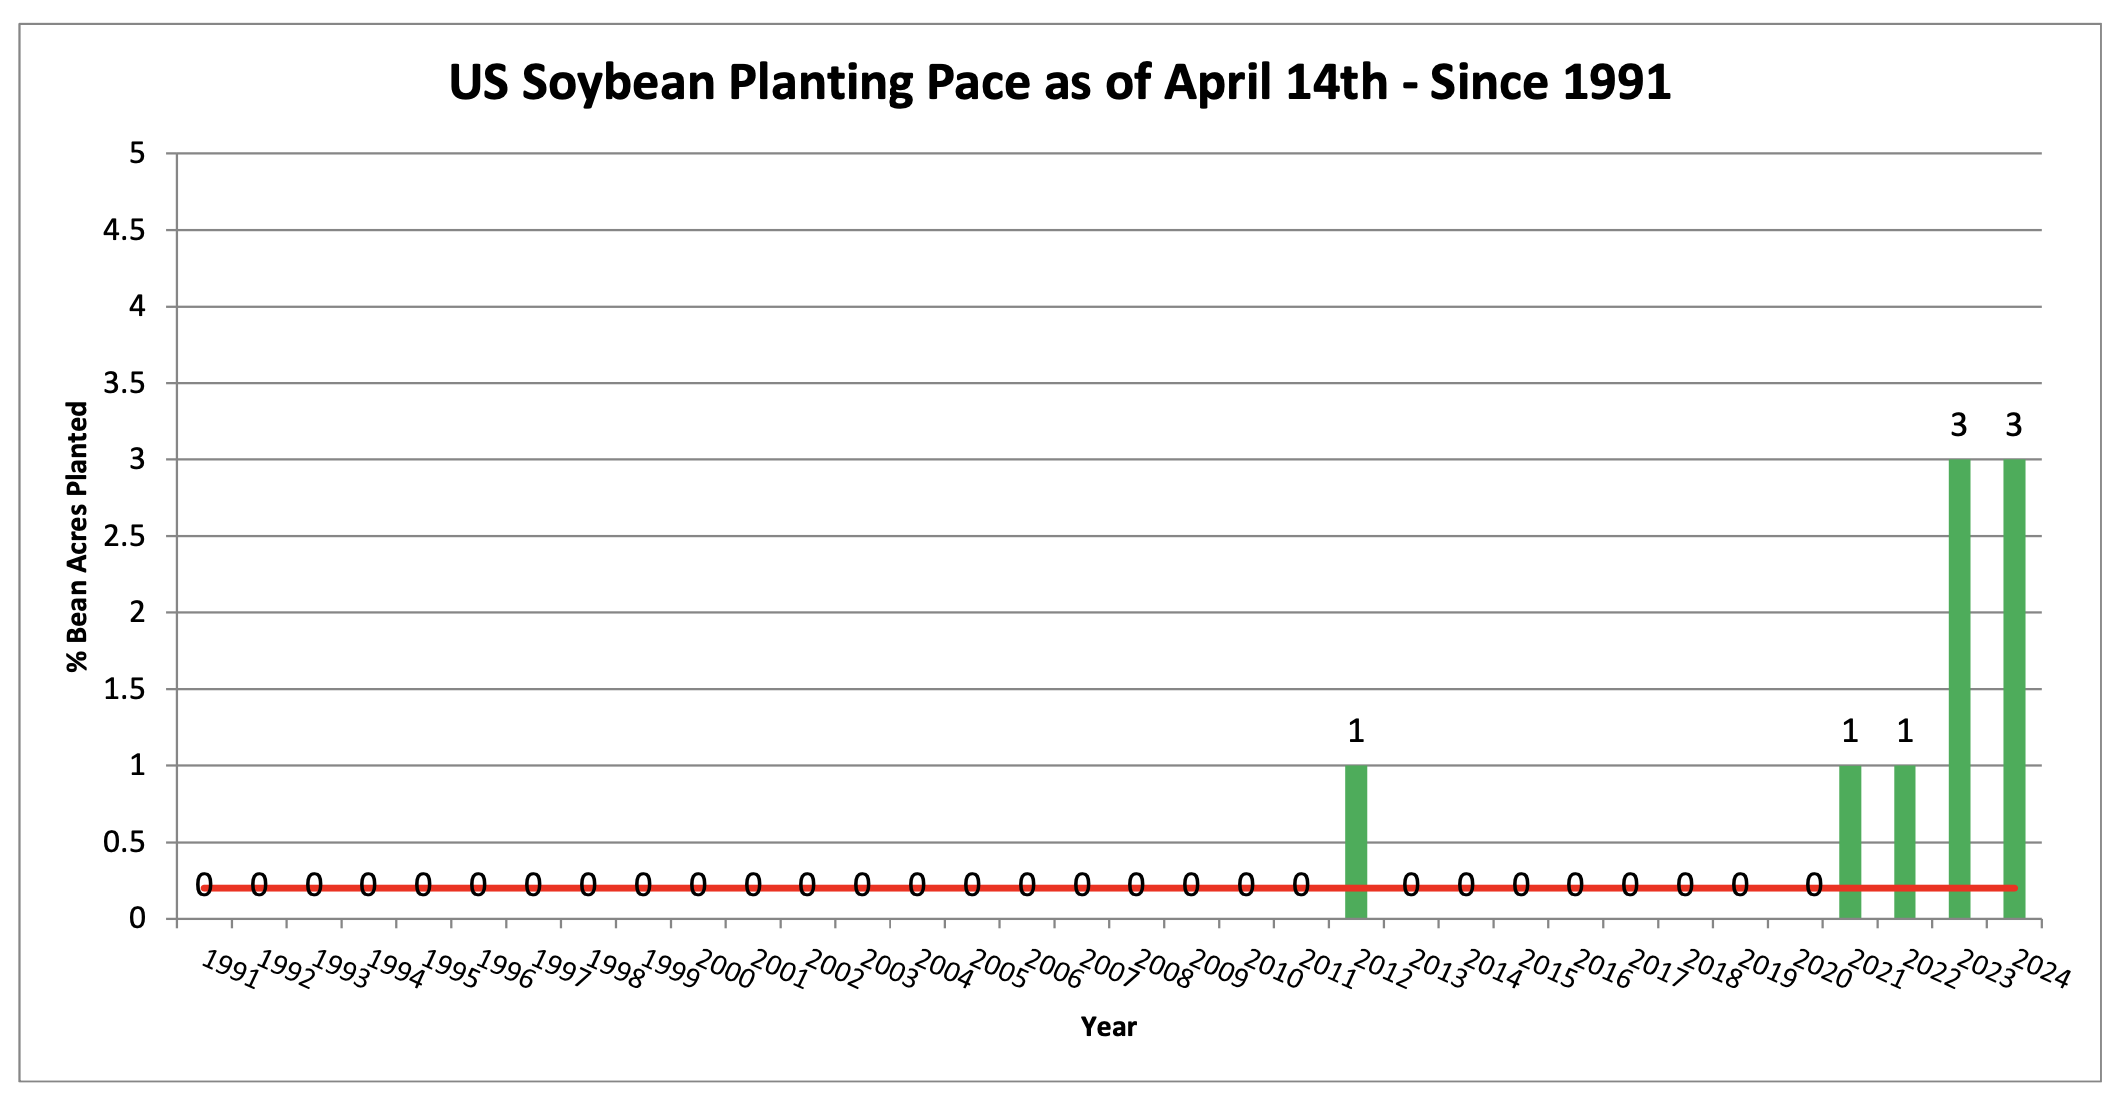
The first soybean planting progress report of the season was released today and shows U.S. soybean planting at 3% vs. 3% LY and 1% on average for this date. IL leads the major Midwest states at 4%, IA at 2%, MN at 1% and MO at 8% planted. IN & OH were both at zero. Here is the US planting pace as of April 14th.
U.S. winter wheat conditions were rated 55% good to excellent which is down 1% from LW and compares to just 27% G&E LY at this time. TX is 48% good to excellent, OK 60%, KS 43%, SD 57% and NE 70% G&E. Just 13% of winter wheat was rated poor to very poor, down from 39% a year ago.
May beans at today’s low are 71 1/2 cents lower than the high made on March 21 near $12.27. May corn continues to slog around in a narrow 10 to 20 cent range. The sharp rally after the planting intentions report seems like it was ages ago as the market failed to get any traction since then. The market is now focused on planting progress, with eyes still watching the geopolitcal issues in Israel/Iran, and Ukraine/Russia.
That’s all for today. See you here tomorrow.
This material should be construed as market commentary, merely observing economic, political and/or market conditions, and not intended to refer to any particular trading strategy, promotional element or quality of service provided by AgriSource Inc. Information contained herein was obtained from sources believed to be reliable, but is not guaranteed as to its accuracy. These materials represent the opinions and viewpoints of the author, and do not necessarily reflect the viewpoints and trading strategies employed by AgriSource, Inc.
AgriSource, Inc. is not responsible for any redistribution of this material by third parties, or any trading decisions taken by persons not intended to view this material. It does not constitute an individualized recommendation, or take into account the particular trading objectives, financial situations, or needs of individual customers. Contact AgriSource, Inc. designated personnel for specific trading advice to meet your trading preferences or goals.